Linux システムを見える化する kernelshark の使い方 第 3 回
2022 年 12 月 19 日 Linux 技術ネタ
目次
はじめに
組込み Linux 開発において、以下のケースに直面することはよくあるのではないでしょうか ?
- 優先度が高いアプリケーションが意図通り動作しているか確認したい
- 定周期のリアルタイムプロセスが期待する周期内に実行完了しないことがあるが何が悪いのかわからない
- 優先度逆転が発生するが原因がわからない
- 開発したドライバの挙動がおかしい。関数経路を調査したい。
このような解析をサポートするために、Linux カーネルには ftrace というトレーサーが搭載されています。様々な情報を取り出せる反面、コマンドラインでの制御が必要なため、使用性が低く、結果ファイルがテキストであるため、可読性が悪いです。この欠点を補うために、OSS ツールとして、ftrace のユーザーインターフェース trace-cmd と結果ファイルをビジュアル表示する kernelshark が用意されています。
このブログエントリでは、組込み Linux からトレースログを取得し、kernelshark で表示する一連の流れと kernelshark の機能概要を紹介します。
本ブログは全 3 部構成となります。
第 3 回目は、trace-cmd の使い方と ftrace の役立つ機能について解説します。
前回:Linux システムを見える化する kernelshark の使い方 第 2 回
5. trace-cmd の使い方
trace-cmd は、ftrace へのユーザーインターフェースとなるコマンドです。
trace-cmd には、以下のサブコマンドが用意されており、サブコマンドを引数指定することにより trace-cmd の振る舞いが決定されます。ここでは、代表的なサブコマンドについて紹介します。
root@raspberrypi3-64:~# trace-cmd
trace-cmd version 2.9.1 (530b1a0caef39466e16bbd49de5afef89656f03f+)

usage:
trace-cmd [COMMAND] ...

commands:
     record - record a trace into a trace.dat file
     set - set a ftrace configuration parameter
     start - start tracing without recording into a file
     extract - extract a trace from the kernel
     stop - stop the kernel from recording trace data
     restart - restart the kernel trace data recording
     show - show the contents of the kernel tracing buffer
     reset - disable all kernel tracing and clear the trace buffers
     clear - clear the trace buffers
     report - read out the trace stored in a trace.dat file
     stream - Start tracing and read the output directly
     profile - Start profiling and read the output directly
     hist - show a histogram of the trace.dat information
     stat - show the status of the running tracing (ftrace) system
     split - parse a trace.dat file into smaller file(s)
     options - list the plugin options available for trace-cmd report
     listen - listen on a network socket for trace clients
     agent - listen on a vsocket for trace clients
     setup-guest - create FIFOs for tracing guest VMs
     list - list the available events, plugins or options
     restore - restore a crashed record
     snapshot - take snapshot of running trace
     stack - output, enable or disable kernel stack tracing
     check-events - parse trace event formats
dump - read out the meta data from a trace file
5.1 サブコマンド record - トレースログのローカル取得 (1)
trace-cmd コマンドのログ取得に使うサブコマンドです。
任意のコマンドを実行し、そのコマンドが実行されている間のトレースログをファイルに書き出します。コマンド指定せずに実行する場合は、Linux の全プロセスが対象となり、ctrl+c で trace-cmd を止めるまでトレースログがファイルに書き出されます。record でトレースログを取得するには、使用するトレーサー、または、イベントを指定する必要があります。
● トレーサーを使用する場合
-p オプションで使用するトレーサーを指定します。以下は、ls /bin の実行を function_graph トレーサーでトレースする例です。
root@raspberrypi3-64:~# trace-cmd record -p function_graph ls /bin
執筆時点で以下のトレーサーが使用可能です。
| トレーサー | 機能説明 |
|---|---|
| function | すべてのカーネル関数呼び出しイベントを取得する。 |
| function_graph | すべてのカーネル関数について、関数に入った時と関数から出たときのイベントを取得する。 さらに、波括弧とインデントを使った C ソース風の呼び出しツリーが出力される。 |
| blk | ブロック I/O のトレーサー。 Blktrace プログラムによって使用される。 |
| hwlat | ハードウェアレイテンシトレーサー。 ハードウェアによって発生したレイテンシを検出する。 Hardware Latency Detector |
| irqsoff | 割り込みが無効になった区間をトレースし、そのレイテンシの最大値をトレース、保存する。 |
| preemptoff | irqsoff と似たような方式で、プリエンプションが無効になった区間をトレースする |
| preemptirqsoff | irqsoff や preemptoff と似たような方式で、irq および/またはプリエンプションが無効になった区間をトレースする。 |
| wakeup | 最も優先度が高いタスクが wakeup してからスケジュールされるまでの最大レイテンシをトレースし、保存する。 |
| wakeup_rt | RT タスクのみに関して、最大レイテンシをトレースし保存する。 |
| wakeup_dl | SCHED_DEADLINE タスクが動き出すまでにかかる最大レイテンシをトレースし保存する。 |
| mmiotrace | バイナリモジュールをトレースするための特殊なトレーサーで、モジュールがハードウェアに対して行う全ての呼び出しをトレースする。 |
| branch | カーネル内の likely/unlikely 呼び出しをトレースする。 |
| nop | 何もしないトレーサー。 全てのトレーサーを止める際は、これを current_tracer にセットする。 |
● イベントを使用する場合
-eオプションでトレースするイベントを指定します。上記のトレーサーとの併用も可能です。有効なイベント名の確認は、後述の trace-cmd list -e を参照ください。以下は、ls /bin 実行中の sched_switch イベントをトレースする例です。
root@raspberrypi3-64:~# trace-cmd record -e sched_switch ls /bin
イベント名の指定にはワイルドカードを使うこともできます。
root@raspberrypi3-64:~# trace-cmd record -e 'sched_*' ls /bin
イベントにはいくつかのフィールドが存在し、フィールド値が特定条件を満たすものだけを取得することも可能です。この場合、-e オプションの直後に -f オプションにて条件式を指定します。直前の -e オプションで指定したイベントのうち、-f の式の条件を満たすもののみが取得されます。フィールドの確認方法は、後述の trace-cmd list -e <event> -F を参照ください。以下は、count フィールドが 100 以下の syscalls:sys_enter_read イベントを取得する例です。
root@raspberrypi3-64:~# trace-cmd record -e 'syscalls:sys_enter_read' -f "count<=100"
root@raspberrypi3-64:~# trace-cmd record --help

trace-cmd version 2.9.1 (530b1a0caef39466e16bbd49de5afef89656f03f+)

usage:
trace-cmd record [-v][-e event [-f filter]][-p plugin][-F][-d][-D][-o file] \
              [-q][-s usecs][-O option ][-l func][-g func][-n func] \
              [-P pid][-N host:port][-t][-r prio][-b size][-B buf][command ...]
              [-m max][-C clock]
          -e run command with event enabled
          -f filter for previous -e event
          -R trigger for previous -e event
          -p run command with plugin enabled
          -F filter only on the given process
          -P trace the given pid like -F for the command
          -c also trace the children of -F (or -P if kernel supports it)
          -C set the trace clock
          -T do a stacktrace on all events
          -l filter function name
          -g set graph function
          -n do not trace function
          -m max size per CPU in kilobytes
          -M set CPU mask to trace
          -v will negate all -e (disable those events) and -B (delete those instances) after it
          -d disable function tracer when running
          -D Full disable of function tracing (for all users)
          -o data output file [default trace.dat]
          -O option to enable (or disable)
          -r real time priority to run the capture threads
          -s sleep interval between recording (in usecs) [default: 1000]
          -S used with --profile, to enable only events in command line
          -N host:port to connect to (see listen)
          -t used with -N, forces use of tcp in live trace
          -b change kernel buffersize (in kilobytes per CPU)
          -B create sub buffer and following events will be enabled here
          -k do not reset the buffers after tracing.
          -i do not fail if an event is not found
          -q print no output to the screen
          -G when profiling, set soft and hard irqs as global
          --quiet print no output to the screen
          --module filter module name
          --by-comm used with --profile, merge events for related comms
          --profile enable tracing options needed for report --profile
          --func-stack perform a stack trace for function tracer
             (use with caution)
          --max-graph-depth limit function_graph depth
          --cmdlines-size change kernel saved_cmdlines_size
          --no-filter include trace-cmd threads in the trace
          --proc-map save the traced processes address map into the trace.dat file
          --user execute the specified [command ...] as given user
          --tsync-interval
set the loop interval, in ms, for timestamps synchronization with guests:
If a negative number is specified, timestamps synchronization is disabled
If 0 is specified, no loop is performed - timestamps offset is calculated only twice,
at the beginnig and at the end of the trace
5.2 サブコマンド start,stop および extract - トレースログのローカル取得 (2)
trace-cmd start で、バックグラウンドでのトレースを開始します。
取得されたトレースログは、ファイルではなく Linux カーネル内のリングバッファに保存され
ます。
trace-cmd stop で、バックグラウンドでのトレースを停⽌します。
trace-cmd extract で、バックグラウンドで取得したログをファイルに書き出します。
trace-cmd start で、バックグラウンドのトレースを開始します。
record と同様に、使⽤するトレーサー(-p)、または、イベント(-e)を指定する必要があります。
root@raspberrypi3-64:~# trace-cmd start --help

trace-cmd version 2.9.1 (530b1a0caef39466e16bbd49de5afef89656f03f+)

usage:
 trace-cmd start [-e event][-p plugin][-d][-O option ][-P pid]
          Uses same options as record.
          It only enables the tracing and exits

    --fork: If a command is specified, then return right after it forks

root@raspberrypi3-64:~# trace-cmd stop --help

trace-cmd version 2.9.1 (530b1a0caef39466e16bbd49de5afef89656f03f+)

usage:
 trace-cmd stop [-B buf [-B buf]..] [-a] [-t]
          Stops the tracer from recording more data.
             Used in conjunction with start
             -B stop a given buffer (more than one may be specified)
             -a stop all buffers (except top one)
             -t stop the top level buffer (useful with -B or -a)

root@raspberrypi3-64:~# trace-cmd extract --help

trace-cmd version 2.9.1 (530b1a0caef39466e16bbd49de5afef89656f03f+)

usage:
 trace-cmd extract [-p plugin][-O option][-o file][-B buf][-s][-a][-t]
          Uses similar options as record, but only reads an existing trace.
          -s : extract the snapshot instead of the main buffer
          -B : extract a given buffer (more than one may be specified)
          -a : extract all buffers (except top one)
                -t : extract the top level buffer (useful with -B and -a)
5.3 サブコマンド listen - トレースログのリモート取得
trace-cmd で取得するトレースログは、フィルタ設定によりサイズが非常に大きくなります。ターゲットボードのストレージが小さい場合などのために、trace-cmd listen を用いたリモートでのログ取得機能が用意されています。
lineo@lineo-VirtualBox:~$ trace-cmd listen --help

trace-cmd version 2.9.1 (530b1a0caef39466e16bbd49de5afef89656f03f+)

usage:
 trace-cmd listen -p port[-D][-o file][-d dir][-l logfile]
         Creates a socket to listen for clients.
         -D create it in daemon mode.
         -o file name to use for clients.
         -d directory to store client files.
               -l logfile to write messages to.
● ホストマシン側
trace-cmd listen を実行します。
-p オプションでクライアントの接続を待ち受けるためのポート番号の指定が必要です。
# ホスト側 (任意のポート番号)
$ trace-cmd listen -p 60010
● ターゲット側
trace-cmd record の -N オプションを用います。
-N オプションのパラメータとして、接続先ホスト(ip アドレス)とポート番号を指定することで、record で取得されたログはターゲット上のローカルファイルとして保存される代わりにホストマシンへ転送されます。
# ターゲット側 (ホスト側が待ち受けているポートへ繋ぎに行く)
$ trace-cmd record -N 172.31.x.x:60010 -e xxx -- ls -l
listen を使ったリモート操作は通常の TCP 通信を介してデータのやり取りが行われるため、セキュリティの観点から VPN や SSH ポートフォワードなどの暗号化通信の使用、または、ターゲット-ホスト間で Ethernet 直結を推奨します。
5.4 サブコマンド list - 利用可能なイベント一覧の取得
trace-cmd list コマンドに -e オプションを指定して実行することで、利用可能なイベントの一覧を取得できます。各イベントには <subsystem>:<event> というフォーマットで名前が付けられています。
root@raspberrypi3-64:~# trace-cmd list -e | head
initcall:initcall_finish
initcall:initcall_start
initcall:initcall_level
raw_syscalls:sys_exit
raw_syscalls:sys_enter
ipi:ipi_exit
ipi:ipi_entry
ipi:ipi_raise
syscalls:sys_exit_unshare
syscalls:sys_enter_unshare
また、各種イベントが持つフィールドの確認には、trace-cmd list -e <event> -F を使用します。
root@raspberrypi3-64:~# trace-cmd list -e syscalls:sys_enter_read -F
system: syscalls
name: sys_enter_readahead
(省略)
system: syscalls
name: sys_enter_read
ID: 641
format:
        field:unsigned short common_type;       offset:0;       size:2; signed:0;
        field:unsigned char common_flags;       offset:2;       size:1; signed:0;
        field:unsigned char common_preempt_count;       offset:3;       size:1; signed:0;
        field:int common_pid;   offset:4;       size:4; signed:1;

        field:int __syscall_nr; offset:8;       size:4; signed:1;
        field:unsigned int fd;  offset:12;      size:4; signed:0;
        field:char * buf;       offset:16;      size:4; signed:0;
        field:size_t count;     offset:20;      size:4; signed:0;
(省略)
6. ftrace の便利な機能
最後に、ftrace の便利な機能を紹介します。紹介する機能は、trace-cmd では非対応です。
6.1 ユーザーイベント
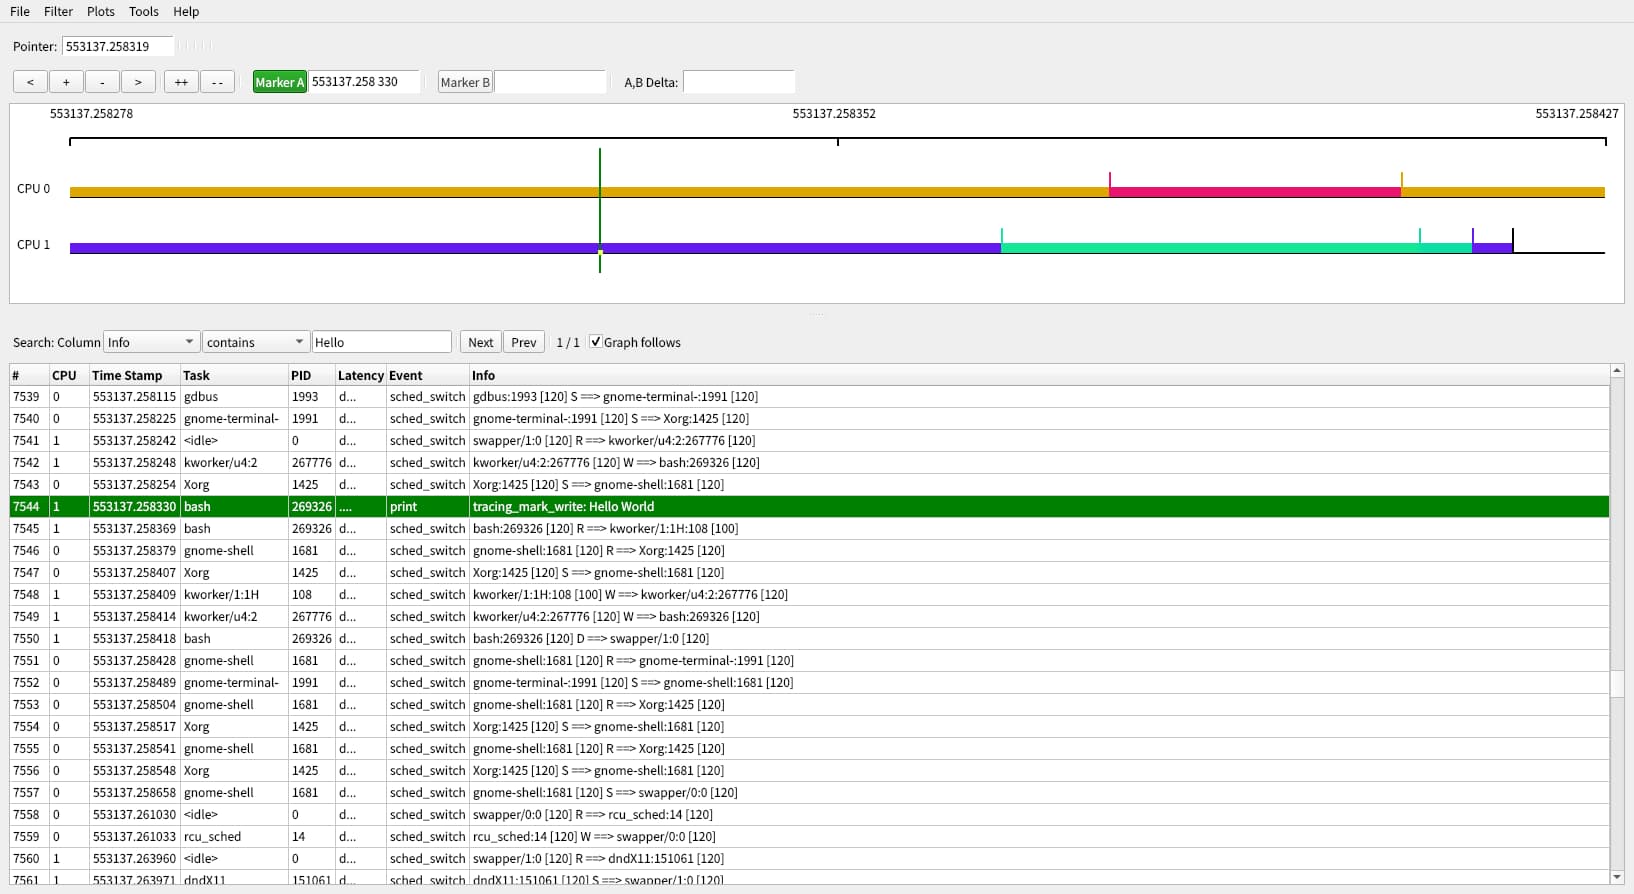
ftrace は、アプリケーションからユーザーイベントを記録する機能を持ちます。インターフェースである trace_marker に文字列を書き込むと、その文字列がイベントとして記録されます。下記のグラフは、sched_switch イベントトレース中に、別端末で trace_maker に Hello World と書き込んだ場合です。
$ echo "Hello World" > /sys/kernel/debug/tracing/trace_maker
tracing_marker_write: Hello World というイベントが記録されます。
以下は kernelshark で該当イベントを確認した様子です。
C プログラムからは、例えば、以下のようにして trace_marker に書き込むことが可能です。
[...]

int main(int argc, char **argv)
{
	char path[256];
	int marker_fd = -1;
	strcpy(path,"/sys/kernel/debug/tracing/trace_marker");
	marker_fd = open(path, O_WRONLY);
	if (marker_fd >= 0)
            write(marker_fd, "Hello World\n", 12);

[...]
}
7. まとめ
本ブログエントリでは、組込み Linux からトレースログを取得し、kernelshark で表示する一連の流れと kernelshark の機能概要を紹介しました。
- ftrace は Linux カーネルに搭載されたトレーサーで、様々情報を取り出すことができるが、そのままでは使用しづらい。
- ftrace を使いやすくするために、制御部分のユーザーインターフェースとして trace-cmd が用意され、結果の表示部分として kernelshark が用意されている。
- kernelshark は、実行プロセスの色分け、表示イベントのフィルタ、特定CPU・タスクのプロット、グラフとログの対応付けなどの表示機能、特定ポイントのマークと2ポイント間の時間などの計測機能を搭載する。
kernelshark は、Linux カーネルの標準機能を活用するため、ソフトのみで Linux カーネル内の振る舞いを見える化でき、かつ、OSS のため、ツール導入コストが低いメリットがあります。また、ユーザーイベントを表示することも可能です。
障害解析時だけでなく、開発したデバイスドライバやアプリケーションの評価の分野でも活用できると考えますので、一度使ってみて下さい。
参考文献

記事カテゴリ別新着一覧
Vigiles サポート

Vigiles ファーストステップガイド 4 「SBOM ダッシュボードの使い方」
2025 年 05 月 14 日 Vigiles サポート
Vigiles ファーストステップガイド 3 「Build root 環境の Vigiles 導入手順」
2024 年 09 月 02 日 Vigiles サポート
Vigiles ファーストステップガイド 2 「Yocto 環境への Vigiles 導入手順」
2024 年 03 月 01 日 Vigiles サポート
Yocto Project よもやま話

Yocto よもやま話 第 19 回 「Yocto Project 5.3 Whinlatter」
2026 年 02 月 09 日 Yocto Project よもやま話
Yocto よもやま話 第 18 回 「Yocto Project 5.2 Walnascar」
2026 年 02 月 09 日 Yocto Project よもやま話
Yocto よもやま話 第 17 回 「Yocto Project 5.1 Styhead」
2026 年 02 月 09 日 Yocto Project よもやま話
Linux 技術ネタ

RISC-Vについて学ぶ-後編
2024 年 01 月 10 日 Linux 技術ネタ

RISC-Vについて学ぶ-前編
2023 年 12 月 12 日 Linux 技術ネタ

デバイスツリーとサウンド設定(widgets, routing)について学ぶ:後編
2023 年 03 月 31 日 Linux 技術ネタ
イベントレポート

EdgeTech+ 2025 出展レポート
2025 年 12 月 01 日 イベントレポート

EdgeTech+ West 2025 出展レポート
2025 年 08 月 08 日 イベントレポート

EdgeTech+ 2024 出展レポート
2024 年 12 月 06 日 イベントレポート
リクルート

新卒採用、絶賛募集中!
2025 年 04 月 01 日 リクルート

新卒採用、絶賛募集中!
2023 年 05 月 30 日 リクルート
大しごとーく & オープン・カンパニー in 信州 2022
2022 年 12 月 27 日 リクルート
信州リネオ便り

松本市のアジサイ寺散策(法船寺・弘長寺)
2026 年 07 月 01 日 信州リネオ便り

新たな信州土産を入手しました
2026 年 05 月 25 日 信州リネオ便り

旧制松本高等学校を歩く
2026 年 04 月 09 日 信州リネオ便り
ソリューション統括部

Zephyrブログ 第三回 「LCD に表示してみる」
2026 年 05 月 26 日 ソリューション統括部
Zephyrブログ 第二回 はじめての Zephyr(後編)
2026 年 04 月 14 日 ソリューション統括部
Zephyrブログ 第一回 はじめての Zephyr(前編)
2026 年 03 月 18 日 ソリューション統括部
マーケティング統括部

大成功決起大会!!(ET2019)
2019 年 12 月 13 日 マーケティング統括部

ESEC 2019 決起大会
2019 年 04 月 25 日 マーケティング統括部

シリコンバレー探検記 その 2
2018 年 12 月 18 日 マーケティング統括部